UEFA Nations League B Grp. 4 · Strawberry Arena · 28 Sep 2026
28 Sep 2026
Match analystData
Five things to know
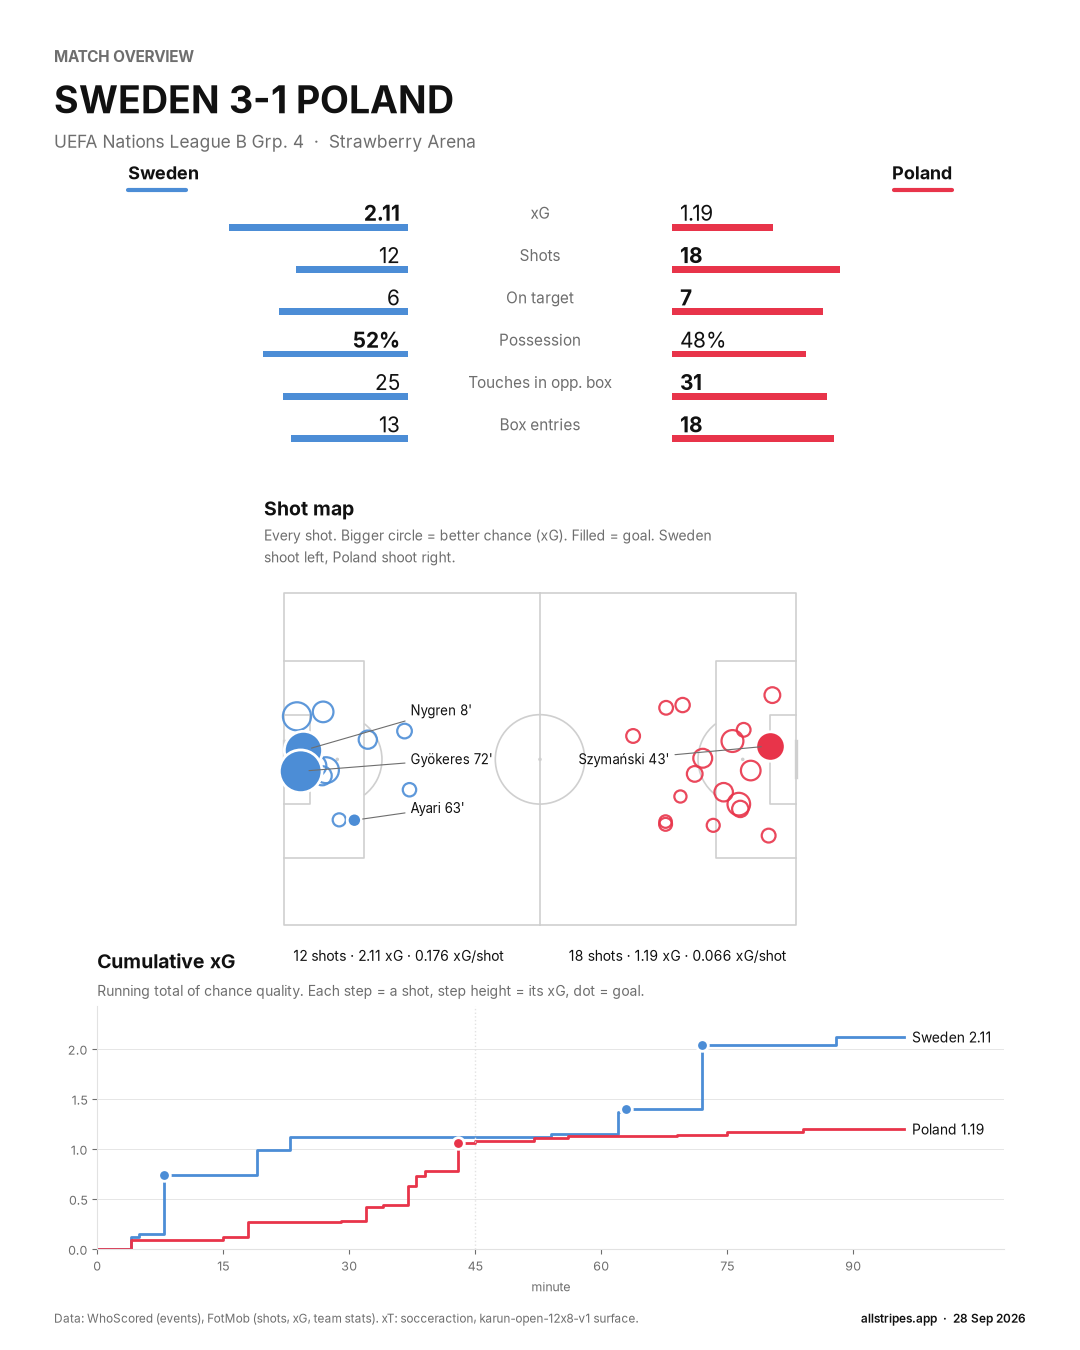
Poland out-shot Sweden 18-12 but lost the xG 1.19-2.11xG per shot: Poland 0.066, Sweden 0.176 (2.7x)
Sweden scored 2 from 3 set-piece shots0.62 xG from set pieces
Chances worth 0.30+ xG: Poland 0, Sweden 2Best Poland chance: Sebastian Szymański 43' (0.28 xG)
50% of Poland's shots came from outside the box9 of 18 for 0.29 xG; Sweden: 3 of 12
High turnovers: Poland 5, Sweden 32 of Poland's led to a shot within 20 s
Match analystData
Shots and chance quality
Poland
Sweden
Shots
18
12
On target
7
6
xG
1.19
2.11
xG per shot
0.066
0.176
Shots from outside the box
9
3
Chances worth 0.30+ xG
0
2
Best Poland chance: Sebastian Szymański, 43', 0.28 xG (goal).
Match overviewTap to enlargeHow to read this chart
Top bars: each pair adds up to 100%, so the longer bar shows who led that stat.
Shot map: one circle per shot. Bigger circle = better chance (higher xG). Filled = goal.
Cumulative xG: the line steps up with every shot by that shot's xG. The team whose line ends higher created the better chances overall.
Match analystData
How Poland progressed
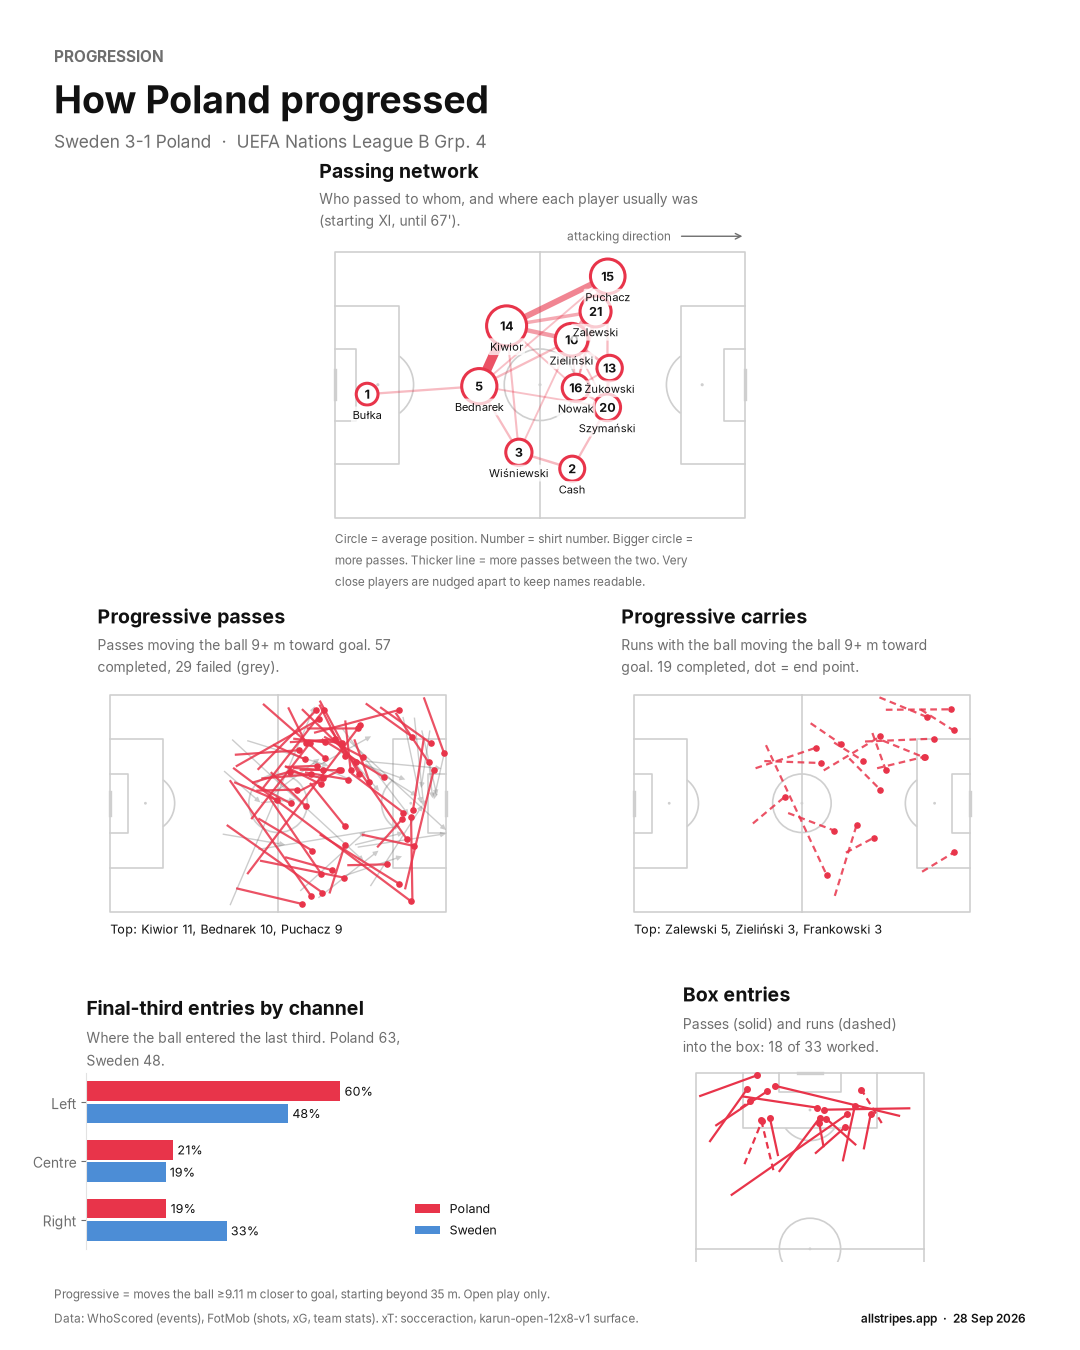
Mostly down the left: left 47%, centre 37%, right 16% of progressive passes and carries.
63 final-third entries (Sweden 48).
18 of 33 attempts to enter the box completed.
Most progressive passes: Jakub Kiwior (11); carries: Nicola Zalewski (5).
Most-used connection: Jan Bednarek - Jakub Kiwior (43 passes).
ProgressionTap to enlargeHow to read this chart
Passing network: each circle is a player at their average position, with their shirt number. Bigger circle = more passes; thicker line = more passes between those two players.
Progressive passes and carries: moves that took the ball at least 9 m closer to goal. Red = completed, grey = failed, dashed = running with the ball.
Final-third entries: how often the ball reached the last third down each side.
Box entries: completed passes (solid) and runs (dashed) that ended inside the penalty area.
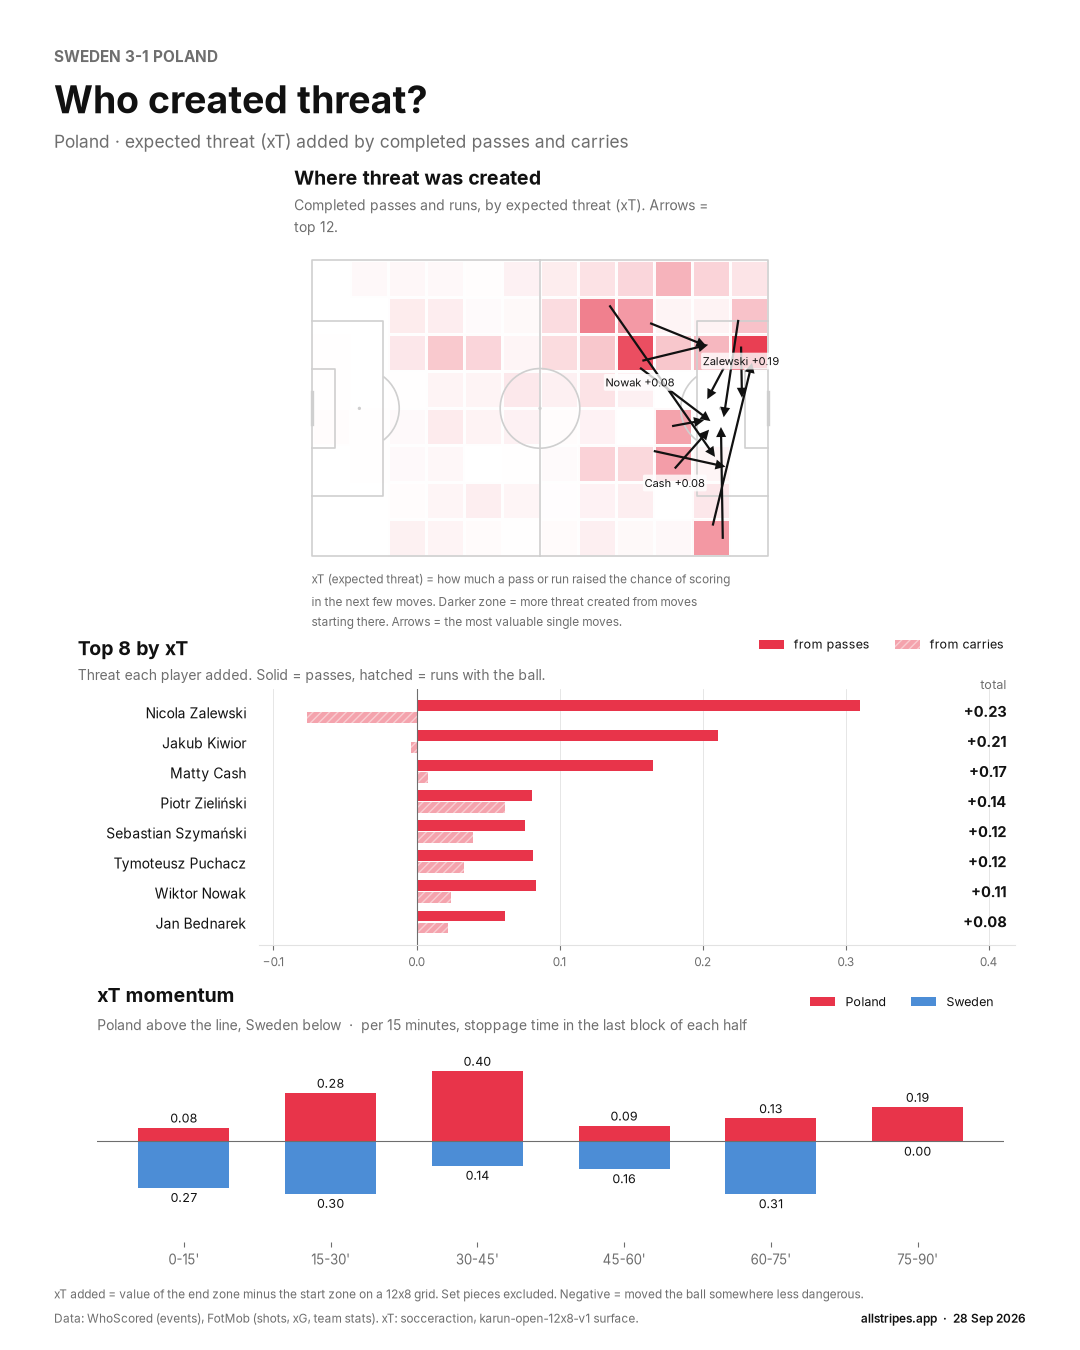
Jakub Kiwior 0.21 xT (0.21 passing, 0.00 carrying)
Matty Cash 0.17 xT (0.17 passing, 0.01 carrying)
Team: Poland 1.16 vs Sweden 1.19.
High turnovers: Poland 5 (2 led to a shot), Sweden 3.
ThreatTap to enlargeHow to read this chart
xT (expected threat) measures how much a pass or run raised the chance of scoring in the next few moves. Moving the ball from midfield to the edge of the box adds a lot; a sideways pass adds little.
Pitch: darker zones are where the most threat was created from. Arrows are the single best moves.
Bars: threat added per player, split into passes (solid) and runs with the ball (hatched). A negative bar means the player often moved the ball somewhere less dangerous.
Momentum: threat per 15 minutes. Poland above the line, the opponent below.
Ask about this match
Poland
Sorted by expected threat. Bold = team best. No composite rating.
Poland players
Player
Pos
Min
xT
xT pass
xT carry
Prog. passes
Prog. carries
Prog. received
Final third
Box entries
Shots
xG
Passes
Def. actions
Nicola Zalewski
FWL
96
0.23
0.31
-0.08
5
5
9
8
3
0
0.00
48
12
Jakub Kiwior
DC
96
0.21
0.21
0.00
11
0
1
18
0
1
0.03
82
8
Matty Cash
DMR
78
0.17
0.17
0.01
3
2
4
3
2
4
0.12
20
6
Piotr Zieliński
MC
78
0.14
0.08
0.06
4
3
8
9
2
6
0.24
48
8
Sebastian Szymański
FWR
78
0.12
0.08
0.04
3
3
12
1
4
3
0.56
25
6
Tymoteusz Puchacz
DML
67
0.12
0.08
0.03
9
1
4
4
4
0
0.00
47
4
Wiktor Nowak
MC
96
0.11
0.08
0.02
5
1
2
5
1
2
0.13
29
10
Jan Bednarek
DC
96
0.08
0.06
0.02
10
0
0
6
0
0
0.00
70
15
Przemysław Frankowski
Sub
29
0.06
0.01
0.04
1
3
0
2
0
0
0.00
21
4
Michał Skóras
Sub
18
0.05
0.03
0.02
1
0
3
1
1
0
0.00
4
1
Przemysław Wiśniewski
DC
90
0.04
0.04
0.00
3
0
1
4
0
1
0.02
30
18
Kacper Urbański
Sub
18
0.01
0.00
0.01
0
1
0
1
0
0
0.00
9
3
Marcin Bułka
GK
96
0.00
0.00
0.00
0
0
0
0
0
0
0.00
10
2
Robert Lewandowski
Sub
6
0.00
0.00
0.00
0
0
1
0
0
0
0.00
1
0
Karol Świderski
Sub
18
-0.01
-0.01
0.00
0
0
3
0
0
0
0.00
6
1
Mateusz Żukowski
FW
96
-0.17
-0.18
0.02
2
0
6
1
1
1
0.10
20
5
Sweden
Sweden players
Player
Pos
Min
xT
xT pass
xT carry
Prog. passes
Prog. carries
Prog. received
Final third
Box entries
Shots
xG
Passes
Def. actions
Patrik Wålemark
MR
82
0.30
0.17
0.13
2
5
3
2
5
2
0.36
22
3
Daniel Svensson
DR
96
0.24
0.23
0.01
5
0
7
6
1
1
0.04
44
10
Victor Nilsson Lindelöf
DC
96
0.19
0.15
0.03
17
3
2
7
0
1
0.09
79
15
Besfort Zeneli
ML
65
0.18
0.21
-0.03
3
2
10
2
1
1
0.13
25
1
Yasin Ayari
MC
91
0.15
0.15
0.00
10
0
6
9
4
2
0.06
74
11
Viktor Gyökeres
FW
91
0.07
0.04
0.03
0
1
9
3
2
2
0.84
21
10
Viktor Johansson
GK
96
0.04
0.04
0.01
1
0
0
3
0
0
0.00
29
4
Carl Starfelt
DC
96
0.04
0.03
0.01
2
2
0
0
0
0
0.00
48
5
Lucas Bergvall
MC
96
0.04
0.02
0.02
8
1
1
6
0
0
0.00
69
7
Gabriel Gudmundsson
DL
96
0.01
-0.02
0.03
1
0
1
3
0
1
0.02
38
7
Benjamin Nygren
FW
82
0.01
-0.01
0.02
1
1
6
4
0
1
0.50
38
7
Alexander Bernhardsson
Sub
14
0.01
0.00
0.01
0
1
1
0
0
1
0.08
2
1
Jesper Karlström
Sub
5
0.00
0.00
0.00
0
0
0
0
0
0
0.00
0
0
Williot Swedberg
Sub
5
0.00
0.00
0.00
0
0
0
0
0
0
0.00
0
0
Hugo Larsson
Sub
14
-0.04
-0.04
0.00
0
0
0
1
0
0
0.00
4
0
Sebastian Nanasi
Sub
31
-0.05
-0.06
0.01
2
1
4
2
0
0
0.00
22
3
Charts
Light versions for the web. Dark versions for X are on the cards page.
Match overviewTap to enlargeHow to read this chart
Top bars: each pair adds up to 100%, so the longer bar shows who led that stat.
Shot map: one circle per shot. Bigger circle = better chance (higher xG). Filled = goal.
Cumulative xG: the line steps up with every shot by that shot's xG. The team whose line ends higher created the better chances overall.
ProgressionTap to enlargeHow to read this chart
Passing network: each circle is a player at their average position, with their shirt number. Bigger circle = more passes; thicker line = more passes between those two players.
Progressive passes and carries: moves that took the ball at least 9 m closer to goal. Red = completed, grey = failed, dashed = running with the ball.
Final-third entries: how often the ball reached the last third down each side.
Box entries: completed passes (solid) and runs (dashed) that ended inside the penalty area.
ThreatTap to enlargeHow to read this chart
xT (expected threat) measures how much a pass or run raised the chance of scoring in the next few moves. Moving the ball from midfield to the edge of the box adds a lot; a sideways pass adds little.
Pitch: darker zones are where the most threat was created from. Arrows are the single best moves.
Bars: threat added per player, split into passes (solid) and runs with the ball (hatched). A negative bar means the player often moved the ball somewhere less dangerous.
Momentum: threat per 15 minutes. Poland above the line, the opponent below.
Answers use only this match's data. AI can be wrong; check the numbers above.